by Calculated Risk on 10/11/2025 08:11:00 AM
NOTE: I’m on vacation returning next week. Government data might be rescheduled due to the government shutdown.
The key economic reports this week are September CPI, Retail Sales and Housing Starts.
For manufacturing, September Industrial Production, and the October New York and Philly Fed surveys will be released this week.
—– Monday, October 13th —–
Columbus Day Holiday: Banks will be closed in observance of Columbus Day. The stock market will be open.
—– Tuesday, October 14th —–
6:00 AM: NFIB Small Business Optimism Index for September.
—– Wednesday, October 15th —–
7:00 AM ET: The Mortgage Bankers Association (MBA) will release the results for the mortgage purchase applications index.
8:30 AM: The Consumer Price Index for September from the BLS.
8:30 AM ET: The New York Fed Empire State manufacturing survey for October.
2:00 PM: the Federal Reserve Beige Book, an informal review by the Federal Reserve Banks of current economic conditions in their Districts.
—– Thursday, October 16th —–
8:30 AM: The initial weekly unemployment claims report will be released.
8:30 AM: The Producer Price Index for September from the BLS.
8:30 AM ET: The Philly Fed manufacturing survey for October.

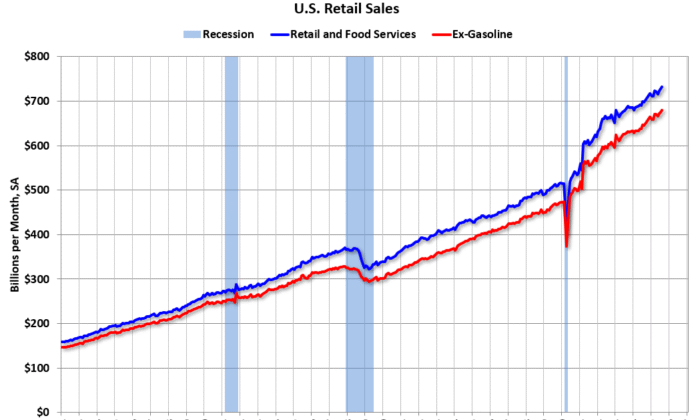
This graph shows retail sales since 1992. This is monthly retail sales and food service, seasonally adjusted (total and ex-gasoline).
10:00 AM: The October NAHB homebuilder survey. Any number below 50 indicates that more builders view sales conditions as poor than good.
—– Friday, October 17th —–
 8:30 AM: Housing Starts for September.
This graph shows single and multi-family housing starts since 1968.
Source link


