:max_bytes(150000):strip_icc():format(jpeg)/BTCUSDChart-742250aef2434bbb9cf3e0c57903171a.gif)
Key Takeaways
- Bitcoin has bounced back from a sharp downturn that briefly pushed the price of the pioneer cryptocurrency below the closely watched $110,000 level on Friday evening, but it remains well below the record high of around $126,000 a week ago.
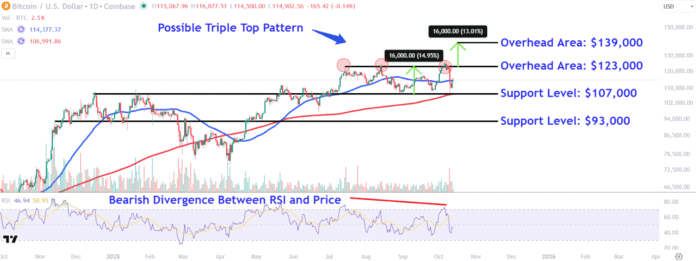
- Since setting the new high just above an established three-month trading range, the price has staged a sharp retreat, raising the possibility of a rare triple top pattern in the process.
- Investors should watch critical support levels on bitcoin’s chart around $107,000 and $93,000, while also monitoring key overhead areas near $123,000 and $139,000.
Bitcoin (BTCUSD) has bounced back from a steep downturn on Friday but remains well below the record high it hit last week.
The sell-off saw bitcoin drop to a low of about $107,000, triggering a record liquidation event across the broader crypto market, with losses totaling $19 billion. The move came after President Donald Trump announced new severe tariffs on China, stoking fears of escalating trade tensions between the world’s two leading economies.
The legacy cryptocurrency started to claw back a portion of those losses after Trump said Sunday that “it will all be fine” with China. Bitcoin was trading at $116,000 in late-afternoon trading Monday, a noteworthy recovery from Friday’s low but still down about 8% from the record high of above $126,000 set a week ago.
Below, we break down the technicals on bitcoin’s chart and identify critical price levels that investors will likely be watching after the cryptocurrency’s recent volatility.
Possible Triple Top Pattern
After hitting a fresh record high just above an established three-month trading range early last week, bitcoin’s price has retreated sharply, raising the possibility of a rare triple top pattern in the process.
Moreover, as the cryptocurrency made a higher high last Monday the relative strength index formed a relatively shallower high to create a bearish divergence, a technical signal pointing to waning buying momentum.
However, in a win for bitcoin bulls, the price found buying interest around the trading range’s lower trendline and sits just above the respected 50-day moving average on Monday.
Let’s identify critical support levels to watch on bitcoin’s chart if the cryptocurrency comes under further pressure and also locate overhead areas worth monitoring.
Critical Support Levels to Watch
The first lower level to watch lies around $107,000. This area on the chart finds a confluence of support from the nearby upward sloping 200-day MA and a trendline that stretches back to the cryptocurrency’s prominent December peak.
A breakdown below this critical location could see a more significant decline to the $93,000 level. Investors may look for entry points in this region around a trendline that links multiple peaks and troughs on the chart between November and May.
Overhead Areas Worth Monitoring
An initial recovery effort may lead to a retest of resistance near $123,000. The cryptocurrency could run into selling pressure in this location near the July, August and September highs, which also mark the recent trading range’s top trendline and potential triple top.
Finally, a breakout to a fresh all-time high could fuel a move toward $139,000. We projected this area by calculating the distance in dollars of the recent trading range and adding that amount to the pattern’s top trendline. For instance, adding $16,000 to $123,000 projects a target of $139,000.
The comments, opinions, and analyses expressed on Investopedia are for informational purposes only. Read our warranty and liability disclaimer for more info.
As of the date this article was written, the author does not own any of the above securities.
Source link


