

ijeab/iStock via Getty Images
It was a good quarter for smid-cap stocks. Our RAM Smid composite gained 10.70% in 3Q25, outperforming the Russell 2500 Value Total Return index which rose 8.17%. On a year-to-date basis, the RAM Smid composite gained 9.29% vs. 9.29% for the Russell 2500 Value Total Return index.
Market cap size was likely a factor for outperformance in 3Q25, as the smaller market cap Russell indices progressively outperformed their larger peers, with the Russell 2000 Value small-cap index gaining 12.6% vs. the 5.29% gain in the Russell 1000 Value large-cap index. Our Smid composite has a substantial amount of small-cap exposure, with an average market cap of $3.15 billion compared to $8.60 billion for the Russell 2500 Value, and $3.02 billion for the smaller cap Russell 2000 Value index.
We see the outperformance of the smaller cap indices in 3Q25 as evidence of investors beginning to rotate their portfolios away from the large-cap indices. We remain optimistic about the Smid value sector heading into 4Q25.1,2,3
Source: Rewey Asset Management, Index returns sourced from Bloomberg 9/30/2025.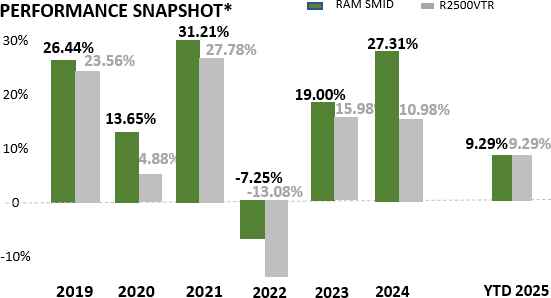
*Note that there are material limitations inherent in any comparison between RAM Smid strategy and the R2500 Value Total Return Index. The R2500 Value Total Return Index is unmanaged, and you cannot invest directly in an index. The RAM portfolio is actively managed and holds concentrated investments in the equity securities of small-mid capitalized companies. Please see important disclosures at the end of this letter.
Negative Labor Revisions Shift the Outlook
On September 9th, the Bureau of Labor Statistics massively revised down its previous estimate of job creation between April 2024 and March 2025 by 911,000 jobs! This adjustment means that average monthly jobs gains were closer to an anemic 71,000, vs. previous estimates of 147,000 per month, a greater than 48% negative revision. Incredibly, this revision follows the similarly massive -818,000 revision for 2024.4
We see two key reasons investors should pay close attention to these revisions. First, there is the critical issue of data quality. In today’s markets, where an enormous amount of capital is managed through short-term trading strategies that react instantly to new data, bad information can translate into poor investment outcomes. In other words, garbage in, garbage out. We have long failed to see the investment rationale for short-term strategies which by design turn time into an adversary rather than an ally. Now, with unreliable data feeding these strategies, their existence seems difficult to justify.
Second, and more relevant for our long-term investment approach, these substantial revisions suggest the labor market has been, and likely still is, much weaker than widely believed. Over the last two years, in our conversations with companies in several capital-equipment driven sectors, including technology, energy, industrials and healthcare, we have frequently heard descriptions of recession-like conditions in sales. These massive negative labor revisions lend credence to the thesis that a significant portion of the U.S. capital goods sector has been in a recessionary environment, likely stemming from the massive increase in Fed funds rates from March 2022 to July 2023, where rates surged 525 basis points.
We also believe that the impact of the “Liberation Day” tariff announcements on April 2nd further suppressed economic activity as companies paused significant investments until they could better assess the implications of the tariffs on their operations. We believe evidence of this weak economic environment was not clearly seen in first half GDP results of -0.5% for 1Q25 and 3.8% for 2Q25, due to the impact of the massive imports of goods and gold into the U.S. in 1Q25, and the reversal of some of this impact in 2Q25 (as we discussed in our 1Q25 letter).
Could Weaker Labor Drive the Fed to Cut More Aggressively?
The Federal Reserve Reform Act of 1977 requires the Fed to pursue a dual mandate of maximum employment and stable prices. On September 17th, the Fed cut its Fed funds rate even though its own SEP (which is not a formal projection) shows that the committee expects inflation to be at 3.0% in 2025 and 2.6% in 2026, both above its target of 2%. Additionally, GDP for 2025 and 2026 was revised higher in the SEP as well, to 1.6% and 1.8%, respectively. From the mandate of stable prices, there does not seem to be a compelling case to support the current Fed easing stance.5
Thus, we believe this cut shows the growing impact of weak labor on the Fed’s decision. During the press conference, Chairman Powell stated that “downside risks to employment have risen” and that “the recent pace of job creation appears to be running below the breakeven rate needed to hold the unemployment rate constant.” We see this language as clear evidence that the Fed cut rates due to worries over weaker labor vs. higher inflation.6
The Looming Impact of AI on Labor…and the Fed?
The most significant quote we heard from a management team this quarter was in the Information Services Group (III) 2Q25 conference call where CEO Connors stated: “clients are riding the AI wave and investing aggressively in modernizing their technology operations and infrastructure to support it… to fund these investments, clients remain focused on cost optimization.”
Even Walmart CEO, Doug McMillon was quoted in the Wall Street Journal on Sept 29th: “Maybe there’s a job in the world that AI won’t change, but I haven’t thought of it.”
Companies are pushing forward with AI implementation at an accelerating pace. To fund this investment, many companies are not increasing spending overall but cutting costs as an offset. We think companies are likely to aggressively cut labor to fund AI investments. We think the efficiency and productivity implications are nascent, and that over a short period of time the cost and efficiency gains from AI will dwarf the productivity boom of the early 2000’s that was driven by the adoption of the internet. And, we are now, unfortunately, convinced of the view that labor reductions will be where a significant, if not majority, of these productivity gains come from.
Thus, we think the Fed will continue to be under pressure to cut Fed fund rates as part of its dual mandate to try to maximize employment, regardless of whether inflation hits its 2% long-term goal or not, due to mounting AI driven job cuts.
Green Shoots, Rate Cuts and Rotation to Spur Small Caps?
The good news, in our view, is that the U.S. economy has started to strengthen from the late 2024 and 1H25 capital goods sector weakness. Recent conversations with aerospace, semiconductor equipment, industrial and even consulting companies point to stronger end market demand in late 2Q25, with backlogs clearing and shipments rising to meet demand. This green-shoots commentary has in the past been a strong sign for small and smid-cap stocks, as, in our view, the most compelling cyclical investment opportunities happen as the economic cycle first inflects positively. Tailwinds supporting this activity likely include clarity on the tariff situation and the impact of bonus depreciation treatment of CAPX in the passage of Trump’s Big Beautiful Bill.
This emerging economic strength is likely to be supported by the Fed rate cut of 25 bps on September 17th. If the consensus is right, the Fed is likely to cut 25-50 additional bps this fall. A cyclical upturn and a Fed rate cut cycle are, in our view, two powerful factors that could continue to support small and smid cap stocks.
The Implications of Liquidity on Rotation
If investors begin rotating toward small and smid-cap stocks, the shift could turn into a stampede. A modest reallocation, just 1% of S&P 500 market value to the Russell 2500 Value Index would equate to buying 11% of that index. 1% of the S&P 500 equates to a whopping 32% of the Russell 2000 Value Index. The S&P 500 has outperformed the Russell 2500 Value index by over 35% (61.74% vs 26.60%) and the Russell 2000 value by almost 42% (61.74% vs 19.75%) since March 16, 2022, the day the Fed first raised rates from the 0% level. In our view, it is highly conceivable that investors look to reallocate much more than 1% S&P 500 allocation as Fed funds rates begin to decline.7
Portfolio Highlights
We added two new positions in 3Q25 and while we reduced some positions, we did not sell any positions to zero. The combined weight of our top 10 holdings was stable at 46.9% vs. 47% at 2Q25. At quarter end, cash was 3.5% of the portfolio. While we continue to search for, and find, stocks that fit our investment philosophy, we also very much like the composition of our current portfolio and are believers in the benefits of long-term compounding with modest portfolio turnover.
Eight of our composite holdings had net cash on the balance sheet and eight others had net debt to EBITDA less than or equal to 1.5x. Fourteen holdings were trading at less than 1.5x book value.8
Varex Imaging (VREX)
Varex Imaging was our top 3Q25 performer, posting a return of 43.02%. Its share price recovered from its “Liberation Day” sell off as the investors recognized the tariff impact on VREX should not be as bad as feared. VREX’s China business predominantly serves only China, and the market there for VREX has improved. VREX also has significant flexibility to move production globally to offset the worst impacts of tariffs. We continue to think VREX is undervalued and neglected, as analysts have not recognized the healthcare CT market recovery and the growing strength of its security screening offerings.9
Kyndryl (KD)
Kyndryl was our weakest performer in 3Q25, down 28.43%, as its FY1Q26 report showed that its revenues came in a bit below street expectations. We think the decline is an overreaction, as Kyndryl reiterated that it still expects to post positive revenue growth for Fiscal 2026, and to deliver sustained growth over at least the next several years. We maintain our optimism on KD and see opportunity in the shares at current levels.10
Ultra Clean Holdings (UCTT)
We continued to build our position in Ultra Clean Holdings, adding on price weakness early in the quarter. UCTT is a $1.2 billion market cap supplier for the semiconductor capital equipment industry, focusing on gas delivery systems. It also provides cleaning services for installed equipment. Lam Research is UCTT’s largest customer at 33% of revenues, Applied Materials is number two at 23% while service makes up 12% of revenues. UCTT shares ended the quarter at $27.29, well below their 52-week high of $41.84, due to the continued weak semi capital equipment (capx) spending environment in 1H25, which was likely impacted by the global investment pause caused by the ‘Liberation Day’ tariffs. We see a compelling investment outlook for UCTT as we think the semi-capx cycle has begun to inflect positively, while street revenue and earnings estimates have yet to discount this expected improvement.
We believe UCTT will be able to retain and potentially improve its strong financial profile over the balance of 2025 and into 2026 even as it continues to invest in new products and capacity. On September 15th, UCTT revamped its term loan facility with Barclays to reduce the variable interest rate spread over SOFR by 50 basis points. This reduction, combined with the 25 bps Fed funds cut on Sept. 17th reduces UCTT’s borrowing costs by 75 bps for 4Q25 forward, before any additional potential Fed easing. As of 2Q25, UCTT’s gross debt was $478.4 million, offset by $327.4 million in cash, for a net debt/EBITDA ratio of approximately 1x.
We see three potential earnings growth drivers for UCTT now, including secular growth of the logic and foundry space, a nascent cyclical recovery in semi-conductor capx spending and a strong self-help program of capacity re-alignment that should drive margin growth irrespective of any potential revenue improvement. We believe theme of advanced semiconductor capabilities is well understood by investors and UCTT plays into this theme by offering foundry applications including packaging and GAA (Gate-All-Around) to support AI. We think UCTT will continue to grow in this area as it invests in new products. Its 2Q25 announcement of new a new business win in its Czech facility for a new product is a positive catalyst. Also, Lam Research has indicated it is increasingly looking to qualify suppliers for progressively more technical specifications.
We believe the cyclical recovery potential of UCTT has not been recognized by investors. Since peaking in 2022 at $2.37 billion, UCTT’s revenues have fallen to an expected $2.05 billion in 2025 (down 15%), as logic and memory demand has been soft. UCTT’s gross margins have fallen over 300 basis points, from 19.2% to an estimated 16.1%, over the same period. This softness has seen shares of UCTT fall from $65.33 in 2021 to $27.29 at the end of 3Q25. We believe the strongest investment returns in cyclical investing are made when a downcycle first inflects positively, in hopes of starting a cyclical upswing. In this sense, we note in its most recent slide-deck update, UCTT states that “inventories are stabilizing” and that a “cyclic recovery across end markets [is] continuing.” On its 2Q25 call Lam Research also indicated that “we see a little bit stronger” with WFE estimates now raised to $105 billion for 2025, up from $100 billion. While we are not expecting an overnight recovery, we do see the strong potential for a cyclical recovery to benefit UCTT over the next few years that should allow UCTT to reaccelerate its revenues and margins, and we see time as our investment ally while we await this acceleration.
We also like the aggressive self-help actions that UCTT announced on its 2Q25 earnings call, to reduce costs to support the current revenue run rate of roughly $500 million per quarter, vs. maintaining the capacity for roughly $4 billion in annual revenues. We do not think that UCTT is indicating it will not grow beyond current revenue levels, but it is opportunistically re-allocating labor and facility priorities, an effort that is overdue in our view. UCTT indicated it should see the first margin benefits of this streamlining in 4Q25, with further savings over the next few years. This cost-containment effort will likely mean that UCTT recovers its prior gross margin earning potential even more quickly as revenue inflects positively. Further, UCTT just completed its company-wide SAP business system implementation in early July. We have seen the transition to SAP as a powerful margin accelerator in multiple companies over the last decade. As a further potential catalyst, on August 6th UCTT named long time AMAT executive James Xiao as its new CEO. While Mr. Xiao has not commented on his plans for UCTT, we think the addition of an industry veteran is a positive step for UCTT.
We have set our AFV price target at $45.32, approximately 66% above 3Q25’s closing price. Importantly, this estimate is set on what we see as a reasonable mid-cycle recovery level of revenues and earnings, at a level still well below the 2022 peak. This AFV target is just over UCTT’s 52 week high and well below the $65.33 peak set in 2021.
We also think UCTT is a particularly good example of the neglect and undervaluation we see in small caps heading into 4Q25, and why the theme of rotation we wrote about above can potentially prove to be powerful. UCTTs shares have lagged dramatically behind the level of its large-cap customers, as Lam Research shares are up 80% for the year and is at an all-time high, while Applied Materials shares have risen 20% year to date, and these two customers comprised roughly 56% of UCTT’s sales. If investors start to broaden their search for smaller cap companies that can benefit from the same trends as larger cap peers, we think UCTT could be an ideal target.11
Looking Forward
As we enter 3Q25, the market is facing a new set of uncertainties, including the government shutdown, which we expect to be short-lived. But we also note that one of the only certainties we have found in the markets over our 33 years of investing is that the market will always face uncertainties and unexpected shocks. This is why we have built our investment philosophy with a long-term focus that starts with identifying companies with the financial strength to ride out any periods of uncertainty. We then seek to identify a clear plan for value creation over the next 2–3 years. A robust investment case and a long-term view creates time as a powerful ally for value creation and provides a roadmap for purchasing securities at potentially attractive long-term valuation levels.
Looking past the uncertainties, we see several potential catalysts for the small and smid cap sector into year-end, including a continued moderate GDP level, the likelihood of at least one more 25 bps rate cut and a general neglect of the sector that has left many companies at attractive valuation levels.
We appreciate your trust and support. As always, please feel free to contact us to discuss our commentary or to share your thoughts.
Chip
1. Past performance is no guarantee of future results. The RAM SMID Value Composite schedule of net investment performance of Rewey Investment Management LLC (the “Schedule”) represents the activity of separate customer trading accounts managed collectively (collectively the “Accounts”) for the annual and cumulative periods from January 1, 2019 through Sep. 30, 2025. 2022-3Q25 performance unaudited. Please see full Marcum footnotes for RAM Smid composite 2019-2021 at Microsoft Word – {A44BB912-3141-4B59-AE8E-3D695C6B8BD4} (reweyassetmanagement.com). Performance graphic not to scale. The performance results for the period of 1/1/19-11/8/2021 are from accounts managed by Chip Rewey while affiliated with Advisory Services Network.
2,7
- The Russell 2500 Value Total Return Index, Russell 1000 Value Total Return Index, Russell 2000 Value Total Return Index are sourced from Bloomberg. Each of these indices are an unmanaged group of securities considered to be representative of the small and mid-cap stock market, and the large-cap stock market in general, respectively. Indexes are unmanaged and do not incur management fees, costs, or expenses.
- The Russell 2500 Value -Dynamic Index® measures the performance of the small to mid-cap value-dynamic segment of the US equity universe. It includes Russell 2500 Index companies with relatively lower price-to-book ratios, lower I/B/E/S forecast medium term (2 year) growth and lower sales per share historical growth (5 years) and relatively less stable business conditions that are more sensitive to economic cycles, credit cycles, and market volatility based on their stability variables.
- S&P 500 Index is a market capitalization-weighted index of 500 common stocks chosen for market size, liquidity, and industry group representation to represent U.S. equity performance.
- It is not possible to invest directly in an index. There are material differences between the RAM SMID Value Composite portfolio and the indexes used for comparison purposes. The RAM portfolio is actively managed and holds concentrated investments in the equity securities of small-mid capitalized companies. An index is generally designed to illustrate the performance of a specific asset class (i.e. small cap) but is not actively managed and the index performance does not reflect the impact of advisory fees and other investment costs.
- Company level member data for the Russell 2500 Value index, the Russell 2000 Value index and the S&P500 Index is sourced from Bloomberg and Rewey Asset Management proprietary analysis.
3, 8. All portfolio discussions are based off our model RAM Smid portfolio of separately managed accounts. Company financial estimates sourced from Rewey Asset Management proprietary analysis, and Bloomberg BEST company estimates. Historical pricing and company financial data sourced from company 10Q and 10K filings, and Bloomberg. Individual portfolios may hold slight deviations in position sizes, cash levels and positions held. Portfolio statistics discussed are from September 30, 2025. These statistics will likely change over time. Debt/EBITDA ratio comments exclude financial companies due to non-comparability.
4. 2024 and 2025 Bureau of Labor Statistics labor revisions announcement and data available at U.S. Bureau of Labor Statistics : U.S. Bureau of Labor Statistics.
5. Federal Reserve Board meeting statement and Federal Open Market Committee release economic projections from the September 17, 2025 meeting are available at The Fed – September 17, 2025: FOMC Projections materials, accessible version
6. The text of Powells 9-23-25 speech is available here. The full text from Chair Powell’s speech | investingLive
9. All financial ratios, statistics, and projections discussed in the Varex Imaging (VREX) commentary are sourced from VREX 10K, Proxy, 10Q filings, company press releases, company public conference calls and webcasts, company slide presentations, RAM discussions with management, Bloomberg, VREX company webpage and Rewey Asset Management proprietary financial analysis and Rewey Asset Management industry due diligence. Historical share price information sourced from Bloomberg.
10. Kyndryl (KD) quarterly performance information sourced from Bloomberg. Other KD commentary sourced from company earnings releases, 10Q, 10K filings, company presentations, RAM discussions with management, Bloomberg and Rewey Asset Management proprietary analysis.
11. All financial ratios, statistics, and projections discussed in the Ultra Clean (UCTT) commentary are sourced from UCTT 10K, Proxy, 10Q filings, company press releases, company public conference calls and webcasts, company slide presentations, RAM discussions with management, Bloomberg, UCTT company webpage and Rewey Asset Management proprietary financial analysis and Rewey Asset Management industry due diligence. Historical share price information sourced from Bloomberg. Lam Research (LRCX) and Applied Materials (AMAT) commentary sourced from earnings calls and presentations, and pricing is sourced through Bloomberg.
All information contained herein is derived from sources deemed to be reliable but cannot be guaranteed. All economic and performance data is historical and not indicative of future results. These views/opinions are subject to change without notice. No one can predict or project performance, and forward-looking statements are not guarantees. Past performance is not indicative of future results. Investing involves risk, including the loss of principal.
This material is for informational purposes only and is not a recommendation or advice. Investments and strategies mentioned are not suitable for all investors. This does not constitute a recommendation or a solicitation or offer of the purchase or sale of securities. There is no assurance that any securities discussed herein will remain in the portfolio at the time you receive this report or that the securities sold have not been repurchased. Securities discussed do not represent the entire portfolio and in aggregate may represent only a small percentage of the portfolio’s holdings. Before investing or using any strategy, individuals should consult with their tax, legal, or financial advisor.
Rewey Asset Management is a registered investment advisor in the State of New Jersey
Editor’s Note: The summary bullets for this article were chosen by Seeking Alpha editors.
Source link
