3Q 2025 Market Review: Records, Risks, and Reasons for Caution (and Optimism)
On April 2, 2025—”Liberation Day”—President Trump’s tariff plan triggered a sharp 12% drop in the S&P 500 ((SP500), (SPX)) in just four trading days. That shock now feels like a distant memory. Since then, U.S. stocks have put together two strong quarters. In 3Q, the Dow (DOW) rose 5%, the S&P 500 8%, the Nasdaq (NDAQ) 11%, and small-caps (Russell 2000) jumped 12%—their best quarter since 2023 and first new closing all-time high since 2021. Through the end of 3Q, the S&P 500 had set 28 all-time closing highs.
As of October 6, the S&P 500 had climbed more than 30% over the prior six months. History suggests such explosive gains may be difficult to sustain: as CNBC’s Fred Imbert noted, when the S&P has advanced 30%+ over a six-month period, the index has averaged just 3.6% returns in the following three months and 5.9% over the next six months. Even so, those figures are hardly disappointing.
The rally, however, was far from even. An “equal-weight” version of the S&P 500—where every company counts the same—rose only 4% in 3Q. That stands in contrast to the more often cited version of the index, where larger companies like Apple (AAPL) or Microsoft (MSFT) have an outsized impact. In practice, most of the gains came from just a handful of giants. Today, 10 stocks make up more than 40% of the index—an unprecedented level of concentration.
The Fed, Politics, and Policy Shifts
It’s not always easy to say exactly why the stock market moves, but a major driver of the market’s recent advance has been changing expectations about the Federal Reserve. Investors began to believe the Fed would be more willing to cut interest rates, with growing hopes for one or two more cuts (in addition to the 25-bps rate cut that took place in September) before the end of the year.
The policy debate has been anything but quiet. The Trump administration has pressed the Fed to cut rates more aggressively, even attempting to remove Governor Lisa Cook—a move that stirred fresh concerns about the central bank’s independence. For now, markets are comfortable ignoring this break from long-standing norms. But as the “Liberation Day” selloff reminded us, market direction can reverse suddenly, and investor confidence could shift just as quickly.
Earnings, Consumers, and the Real Economy
Corporate earnings for 2Q came in ahead of expectations (although this was due in part to a pull forward in demand due to tariff uncertainty), and momentum likely carried into 3Q despite tariff headwinds (3Q earnings season unofficially starts in mid-October). On 2Q earnings calls, many companies pointed to cost pressures from trade policy but also highlighted measures to offset the impact.
The consumer remained resilient—a key support for the economy—but cracks are forming. Lower-income households are under visible strain, and even higher-income families are beginning to feel pinched by higher borrowing costs and elevated prices in areas like housing and healthcare.
Winners & Losers
The 3Q gains were global, not just confined to the United States. Asian markets posted double-digit gains, with Japan’s Nikkei (NKY:IND)up 11.0%, Hong Kong’s Hang Seng (HSI) up 11.6%, and China’s Shanghai Composite (SHCOMP) up 12.7%. Europe lagged but still delivered a respectable 3.1% gain as measured by the Stoxx Europe 600 (STOXX). Commodities told a mixed story. Gold advanced 15.1% (bringing its year-to-date gain to ~45%), while oil slipped less than 1% despite ongoing geopolitical uncertainty, and Bitcoin (BTC-USD) gained 8%.
Within the U.S., playing defense did not pay off, with the traditionally “safer” Consumer Staples sector the only S&P 500 sector to decline for the quarter, losing almost 3%. The best sectors for the quarter were Technology, which advanced 13.0%, and Communication Services, which gained 11.8%. Through 3Q no sector of the S&P 500 is negative for the year.
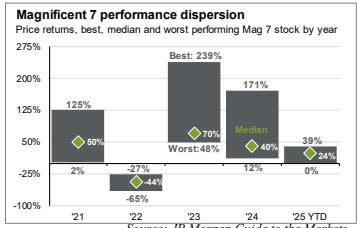
The artificial intelligence trade showed no signs of slowing, with mega-cap companies—including Apple, Alphabet, and NVIDIA (NVDA) —once again powering the market higher. Alphabet rebounded sharply, rising nearly 40% as concerns over antitrust challenges and AI competition eased. But not all of the so-called Magnificent Seven have proven equally magnificent. In 2025, performance dispersion within the group has been significant, ranging from a 39% gain for NVIDIA (through 3Q) to flat returns for Amazon (AMZN), with the median stock still advancing a market-beating 24%. Importantly, without the contribution of the Magnificent Seven, the S&P 500 would have advanced only 11% year-to-date; the group has been responsible for roughly 45% of the index’s 14% overall return. The lesson: even within the market’s most celebrated cohort, selectivity has mattered.
Source: JP Morgan Guide to the Markets
Are Today’s Market Leaders Invincible?
For now, the Magnificent Seven appears to be nearly untouchable, buoyed by formidable advantages such as network effects, cash-rich balance sheets, and massive R&D budgets. Yet history shows that corporate dominance is rarely permanent.
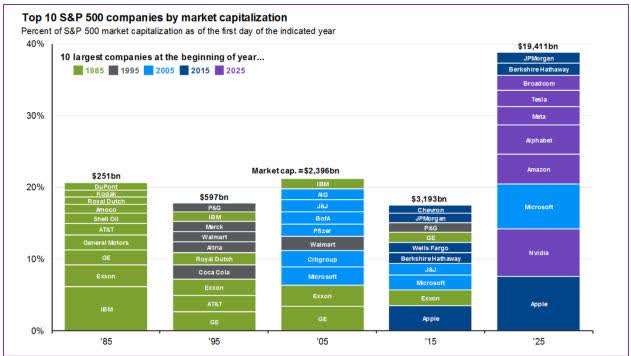
Looking back over the past five decades, the composition of the top 10 U.S. companies by market capitalization has changed dramatically. Of today’s 10 largest companies, only four were on the list a decade ago, and just one appeared two decades ago. No company has remained in the top 10 for all five decades, and only two—GE and Exxon (XOM)—managed to stay there for four.
The lesson is that nothing lasts forever. Many of today’s market leaders command lofty valuations, and while investors are betting heavily that their growth will continue, history suggests such confidence may prove misplaced.
Source: JP Morgan Guide to the Markets
Reasons to Cheer, Reasons to Worry
There are certainly reasons to believe the bull case for stocks remains intact. Earnings growth has been strong, and momentum could carry into 4Q when companies begin reporting 3Q results, even in the face of tariff headwinds. Potential tax cuts and deregulation may further bolster profits, while low oil prices act like a tax cut for consumers, looming rate cuts provide additional support, and a weaker dollar enhances the competitiveness of U.S. goods abroad. Still, while these tailwinds are real, history reminds us that markets often stumble just when the consensus narrative seems most convincing.
The Consumer Is Still Spending
Consumer spending growth (not adjusted for inflation) is running at a steady but modest pace of around 5% year-over-year—enough to keep the economy moving, but not strong enough to drive meaningful economic growth.
While conditions could change, this points to the Fed edging closer to an elusive soft landing, where demand cools without collapsing and policymakers gain cover to consider rate cuts. That said, this is far from a fait accompli : the Fed still faces the delicate task of lowering rates enough to support the labor market, but not so much that inflation reaccelerates.
Housing Could be The Swing Factor
Housing could prove to be one of the key indicators of where the economy goes from here. As we have discussed in previous letters, the U.S. faces a structural housing shortage. Estimates suggest the country needs more than 16 million new homes by 2033—a gap that cannot be closed without a major pickup in construction. For the past few years, higher mortgage rates have sidelined both buyers and sellers, creating an unusual freeze in activity.
Could Interest Rates Be a Tailwind?
While the Fed does not directly control the 10-year Treasury yield—the benchmark for most mortgages—its actions influence the broader rate environment. If mortgage rates ease, housing demand that has been locked up by higher borrowing costs could be unleashed, leading to a surge in transactions, new construction, and ripple effects across the economy from ancillary spending on items like furniture, renovations, and durable goods. This is a real possibility.
Housing directly accounts for about 3%–5% of GDP through residential fixed investment, and its broader influence is even larger when you consider services like rents and utilities.
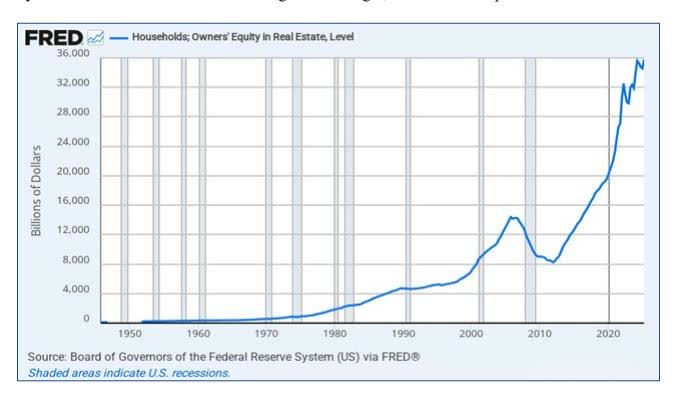
Americans also sit on substantial home equity ($35 trillion in total) a significant portion of which can be unlocked through home equity lines of credit, further stimulating consumption. In this scenario, the wealth effect from housing could provide the economy with another leg up. The key caveat is that long-term rates do not always fall in tandem with Fed policy, as they are also shaped by global capital flows, inflation expectations, and fiscal dynamics.
If the Fed navigates this carefully—and absent major exogenous shocks—housing could be the catalyst that transforms a modest soft landing into a stronger, more durable expansion.
But There are Risks
All is not perfect in the economy or the stock market—nor is it ever. Valuations are stretched by historical standards: the S&P 500 trades at about 23 times expected earnings, a level reached only twice this century. That’s quite expensive compared to its long-term average in the mid-teens. By contrast, there are still a number of good businesses within the index trading below 10 times earnings. Meanwhile, the economy is losing momentum—job growth is faltering, manufacturing is contracting, and housing remains weak.
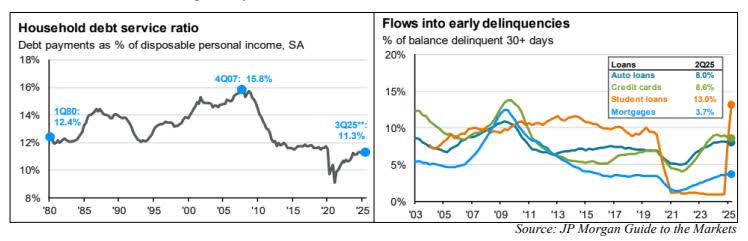
Consumers still appear in reasonably good shape. Many have benefited from large gains in both equities and real estate and carry relatively low debt burdens by historical standards. Yet there are cracks emerging. Early delinquencies are rising across auto loans, credit cards, student loans, and even mortgages a trend we are monitoring closely.
Signs of speculation are also hard to ignore:
Opendoor Technologies (OPEN), an online home-buying platform, has surged nearly 400% this year, at times accounting for 13% of total U.S. trading volume.
More than 90 SPACs have raised $20 billion so far in 2025, making it the busiest year since 2023.
New IPOs are advancing an average of 34% on their first day of trading.
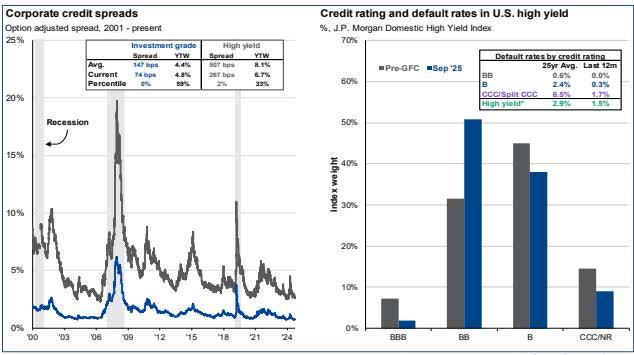
Corporate Credit Has Us Worried
Investment-grade bonds are paying only 0.74% more than Treasuries—the thinnest cushion since 1998. Riskier “junk” bonds yield just 2.7% more than Treasuries, close to the lows of 2007. In other words, investors are being paid a minuscule amount to take on the added risk of investment-grade bonds (historically they have paid an average of 1.47% over Treasuries) and very little to take on the much greater risks of junk bonds, as opposed to past cycles when junk bonds often paid 5%–6% more than Treasuries. As Howard Marks has observed, “the worst loans are made at the best of times.”
At current levels, investors in both investment-grade and high-yield corporate credit are not being adequately compensated for risk. If interest rates rise more than expected or economic growth stalls, holders of these bonds could face substantial losses. For those seeking fixed income exposure, we would remain cautious outside of U.S. Treasuries.
Source: JP Morgan Guide to the Markets
Jamie Dimon’s Warning
JPMorgan (JPM) CEO Jamie Dimon recently struck a more cautious tone than many, as Martin Baccardax of CNBC reported. He warned that markets may be underestimating risks tied to the administration’s pressure on Fed independence, a weaker dollar, and U.S. fiscal fragility. “The level of uncertainty should be higher in most people’s minds than what I would call normal,” he said. “So if the market is pricing in 10%, I would say it’s more like 30%.”
Dimon’s comments point to real concerns, but it’s worth remembering that his track record on big calls has been mixed. In 2022, just before a long bull run, he warned of an economic “hurricane” that never materialized. In 2023, he argued the federal funds rate could reach 7% and the economy would falter neither came to pass.
The AI Trade and Productivity: Transformation Takes Time
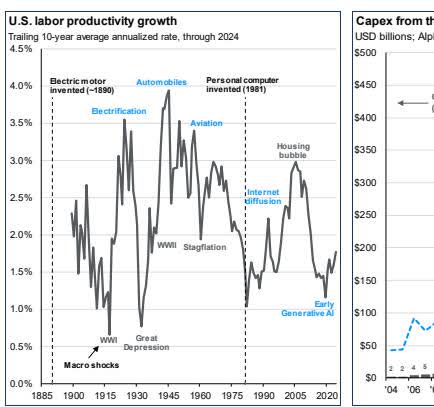
There is little doubt that artificial intelligence will ultimately transform the economy. Its potential to reshape industries, enhance efficiency, and create entirely new business models is real. But investors expecting an immediate payoff may be disappointed. History shows that major technological revolutions rarely translate into instant productivity gains.
Electricity, the internal combustion engine, and the personal computer all profoundly changed the world, but only after long adoption curves. Businesses needed time to reconfigure workflows, build infrastructure, and integrate new tools. Productivity gains from innovation tend to arrive gradually, often after years of trial and error. AI is unlikely to be different.
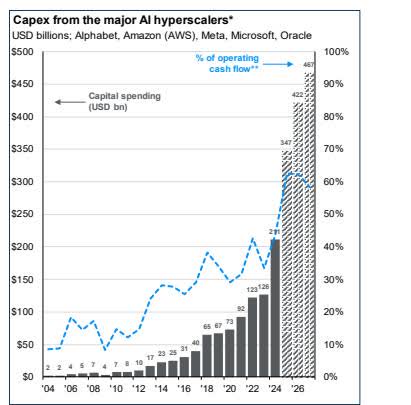
For now, AI-related spending is itself fueling the economy. Companies are pouring billions into data centers, chips, and software development. This investment wave—much of it without near-term payback—has become an important growth driver. But if enthusiasm cools or budgets tighten, the slowdown in AI capex could drag on the economy before productivity benefits have had a chance to appear.
Some forecasters suggest AI could eventually usher in meaningful deflation, as automation reduces costs and prices across industries. That would be a long-term boon for consumers. But in the near term, AI is inflationary, since building the infrastructure requires enormous spending on chips, power, and talent. The disinflationary payoff is more likely to come later, once efficiency gains spread across the economy.
The lesson is that while AI’s potential is enormous, timing matters. The technology will likely change the world, just not as quickly as many investors hope. And until those productivity gains become real, the economy is leaning heavily on AI-driven investment to keep growing—support that could prove more fragile than the current investor optimism suggests.
A Word on Emerging Markets
One of the clearest examples of risk-on sentiment in 2025 has been the outperformance of emerging market equities, which are up 28% year-to-date through early October. Some may dismiss this as simple “catch-up” after a decade in which U.S. equities soared while EM stocks gained a modest 9%. But this rally reflects more than mean reversion—several powerful drivers are at work.
Key drivers of the 2025 rally:
Weakening U.S. dollar: A softer dollar makes it cheaper for emerging economies to service dollar denominated debt and attracts fresh capital inflows.
Shifting global capital flows: With developed markets facing high valuations and lingering uncertainties, investors are seeking opportunity in regions where valuations remain compelling. The MSCI (MSCI) EM Index trades at ~14x forward earnings versus 23x for the S&P 500.
Resilient growth and policy reforms: Several EM countries have delivered robust economic growth and enacted supportive policy measures, making them more attractive destinations for capital.
Risks to the rally
While the performance has been impressive, investors should be mindful of risks. Emerging markets remain highly sensitive to commodity cycles, political instability, and currency volatility. China, which still represents a large portion of EM indices, faces policy uncertainty, a potential trade war with the United States and structural economic challenges. Geopolitical tensions and capital flight risks also make EM investing inherently more volatile than developed markets.
What This Means for Emerging Market Investors
Although the rally has been notable, emerging markets are not a place where every investor needs to have exposure. While the potential rewards can be significant, so too are the risks. For most investors, a simple allocation focused primarily on developed markets—with a large component in U.S. equities—is likely the most prudent path. Many investors and financial advisors have a tendency to overcomplicate portfolios; in our view, simplicity is often the better strategy. A modest allocation to EM may make sense for some, but it should never be at the expense of a well-structured, long-term core portfolio.
Bottom Line
3Q underscored the market’s duality: soaring indices and resilient earnings on one hand, stretched valuations and speculative excess on the other. History reminds us that it is precisely in such moments when optimism feels effortless—that discipline matters most.
At Boyar, our private-equity approach to public markets has always focused on uncovering underappreciated businesses with catalysts for value realization. While the headlines are dominated by a handful of mega-caps, we continue to find compelling opportunities among overlooked companies trading well below intrinsic value. In our experience, it is patience and selectivity in these periods of exuberance that create the best long-term results.
Best regards,
Mark A. Boyar
Jonathan I. Boyar
IMPORTANT DISCLAIMER
Important Disclosures. The information herein is provided by Boyar’s Intrinsic Value Research LLC (“Boyar Research”) and: (A) is for general, informational purposes only; (B) is not tailored to the specific investment needs of any specific person or entity; and (C) should not be construed as investment advice. Boyar Research does not offer investment advisory services and is not an investment adviser registered with the U.S. Securities and Exchange Commission (“SEC”) or any other regulatory body. Any opinion expressed herein represent current opinions of Boyar Research only, and no representation is made with respect to the accuracy, completeness or timeliness of the information herein. Boyar Research assumes no obligation to update or revise such information. In addition, certain information herein has been provided by and/or is based on third party sources, and, although Boyar Research believes this information to be reliable, Boyar Research has not independently verified such information and is not responsible for third-party errors. You should not assume that any investment discussed herein will be profitable or that any investment decisions in the future will be profitable. Investing in securities involves risk, including the possible loss of principal. Important Information: Past performance does not guarantee future results. Any companies mentioned in this are for informational purposes only and the performance of the stock selected is not indicative of the performance of the stocks profiled in Boyar Research, the performance of the stocks selected, and the performance of Boyar Research may in fact diverge materially. This information is not a recommendation, or an offer to sell, or a solicitation of any offer to buy, an interest in any security, including an interest in any investment vehicle managed or advised by affiliates of Boyar Research. Any information that may be considered advice concerning a federal tax issue is not intended to be used, and cannot be used, for the purposes of (i) avoiding penalties imposed under the United States Internal Revenue Code or (ii) promoting, marketing or recommending to another party any transaction or matter discussed herein.
We use cookies to ensure that we give you the best experience on our website. If you continue to use this site we will assume that you are happy with it.

")


