


Yves here. At least for now, market action has confirmed our thesis that even though marked weakening of the dollar is baked in longer term, it would take a long time to play out. BRICS fans have touted the GDP level in the Global South as an indicator of destiny. However, financial markets are dominated by investment flows, not by population or even GDP weight. We have to point out often that the excitement over countries slipping the noose of dollar-system US sanctions by trading bilaterally in their own currencies is not even remotely enough to imperil the dollar. A BIS study found that trade transactions represent about 3% of the value of foreign exchange transactions. Similarly, a recent BIS survey found that the dollar share of foreign exchange transactions had increased since 2022:
Highlights from the 2025 Triennial Survey of turnover in OTC FX markets:
- Trading in OTC FX markets reached $9.6 trillion per day in April 2025 (“net-net” basis,2 all FX instruments), up 28% from $7.5 trillion three years earlier.
- Turnover of FX spot and outright forwards was 42% and 60% higher, respectively. Their shares in global turnover thus increased, from 28% and 15%, to 31% and 19%, respectively. Turnover of FX options more than doubled. Turnover of FX swaps grew modestly, resulting in a drop in their share to 42% (from 51% in 2022).
- The US dollar continued to dominate global FX markets, being on one side of 89.2% of all trades, up from 88.4% in 2022. The share of the euro fell to 28.9% (from 30.6%) and that of the Japanese yen was virtually unchanged at 16.8%. The share of sterling declined to 10.2% (from 12.9%). The shares of the Chinese renminbi and the Swiss franc rose to 8.5% and 6.4%, respectively.
- Inter-dealer trading accounted for 46% of global turnover (almost unchanged from 47% in 2022). The share of trading with “other financial institutions” was 50% (up from 47%). At $4.8 trillion, turnover with other financial institutions was 35% higher than in 2022, mostly driven by 72% higher trading of outright forwards and a 50% increase in spot transactions with this counterparty group.
- Sales desks in the top four jurisdictions – the United Kingdom, the United States, Singapore and Hong Kong SAR – accounted for 75% of total FX trading (“net-gross” basis2). Singapore gained market share, reaching 11.8% of the total (up from 9.5% in 2022).
Advanced economies still have much higher GDP per capita. That translates among other things into more funds available for investment.
What is therefore likely to prove detrimental to the dollar, perhaps sooner rather than later, is dollar investments falling out of fashion. The Liberation Day flight from Treasuries produced a corresponding marked fall in the dollar. That has not only been somewhat reversed but a VoxEU study even found that Treasuries have returned, at least for now, to their status as a haven in times of perceived high risk.
Trump is declaring war on the perceived safety of US financial markets with his continued deregulation push and promotion of crypto-scamming. An AI implosion and/or a private debt market freakout could also lead to flight from dollar investments and hence the dollar.
By Wolf Richter, editor at Wolf Street. Originally published at Wolf Street
A hot theme widely banded about to pump up cryptos, gold, silver, and even stocks is the so-called “currency debasement trade.” The idea is that enough traders rally behind a common theme to move prices in their direction for long enough to make a serious buck and generate fees from the trading.
This debasement-trade theme is a bet that government borrowing and money printing will erode the value of the US dollar dramatically and quickly, and that therefore enough investors will pile into cryptos, gold, silver, and even stocks, to cause prices of those instruments to explode. And they did.
But the huge bond market has taken the opposite bet, led by the $29-trillion Treasury market, the $11-trillion corporate bond market, the $9-trillion residential MBS market, the $4-trillion municipal bond market, plus the other segments of the bond market, where yields have fallen this year and have been in the same relatively narrow range for the past three years.
These bond investors bet that inflation will cool further over the longer horizon, and that the relatively low yields they get on their securities will therefore adequately remunerate them for inflation and for the risks they’re taking, and that the cooling of inflation will cause yields to decline further in the future, thereby pushing up prices of bonds that had been issued earlier at higher yields.
If the bond market were fearing a rapid and substantial debasement of the US dollar – the theme being hyped by the debasement trade promoters – it would demand much higher yields. But that hasn’t been the case.
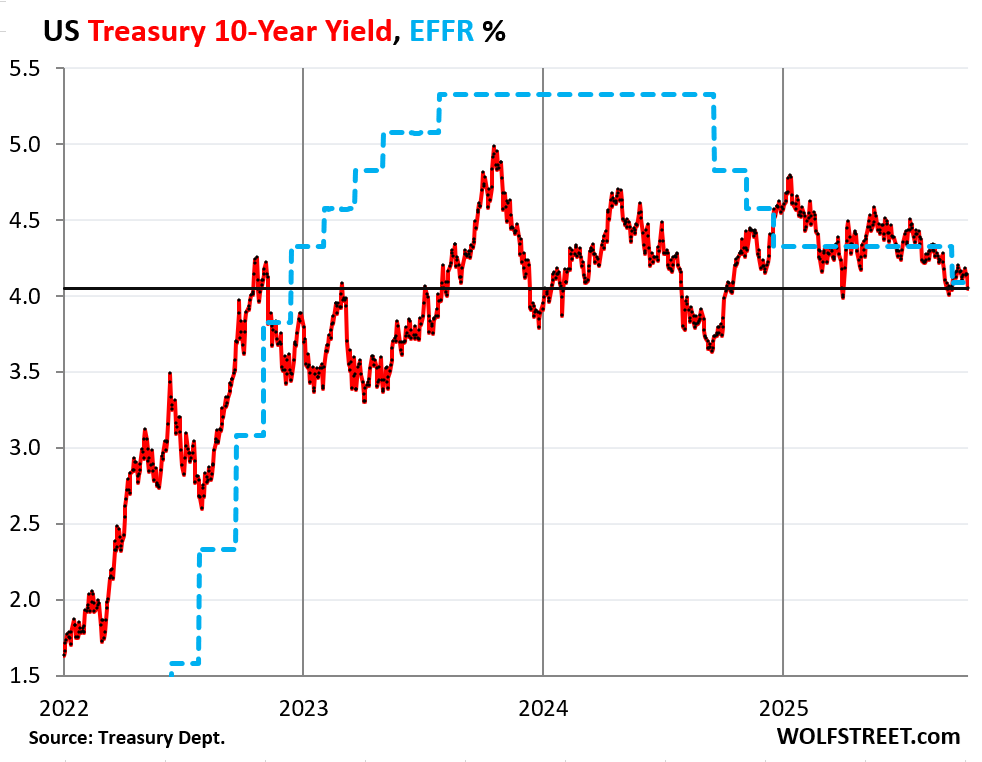
The 10-year Treasury yield, for example — now barely above 4% as of Friday evening (bond markets are closed today) — has been on a downtrend this year and has been roughly in the same range for three years:
But, but, but, the US dollar…. The dollar’s drop during the first half of 2025 has been falsely promoted in clickbait headlines and by braindead manipulative talking heads on TV, as “the steepest decline in more than a half a century,” or whatever.
What did occur is that the dollar indices had spiked in the last four months of 2024 and topped out at the very end of December. And that four-month spike was then unwound-plus-some over the six months exactly from the beginning of January through the beginning of July, with the euro and yen dominated DXY Dollar Index dropping 11% and the broader WSJ Dollar Index [BUXX] dropping 9% over the first six months of the year.
But even bigger six-month drops were common and bottomed out in:
- April 2023
- September 2020
- November 2010
- August 2009
- April 2008
- June 2007
- Etc., all the way back to Adam and Eve.
The only thing that was unique about the 6-month drop in 2025 was that it started at the beginning of January. Only the start date was unique.
This chart shows the 6-month percentage change of the WSJ Dollar Index [BUXX], which tracks a basket of 16 major currencies.
The blue line indicates the 6-month 9% drop from the beginning of January through the beginning of July. Note all the even bigger 6-month drops that have dropped through the blue line over the past 23 years.
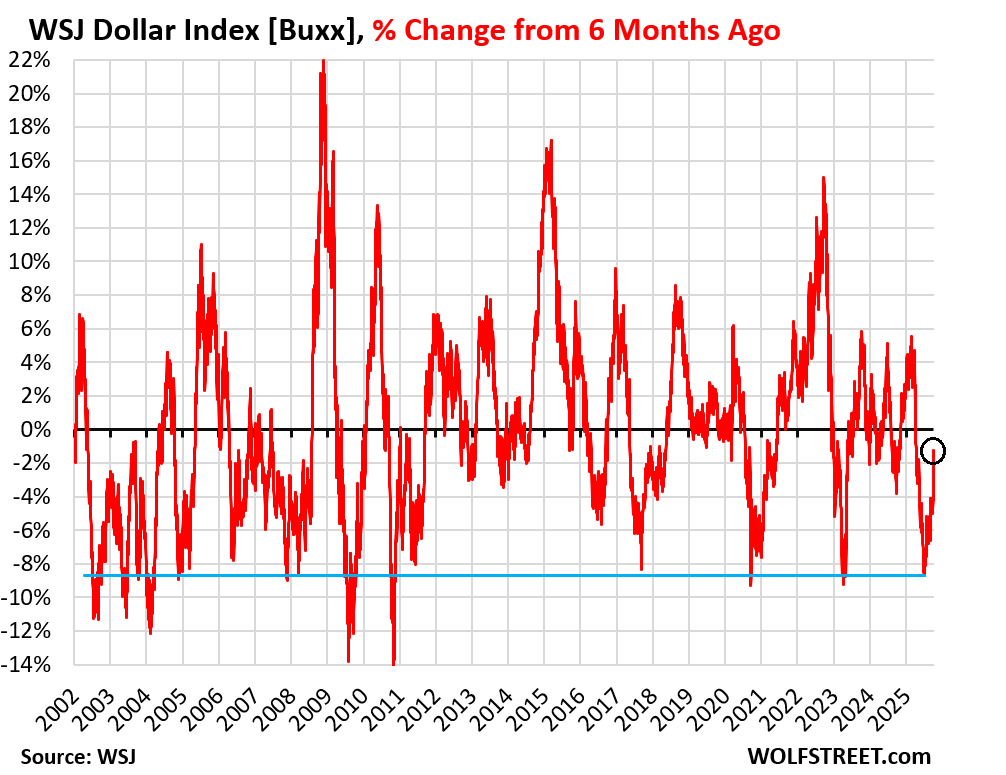
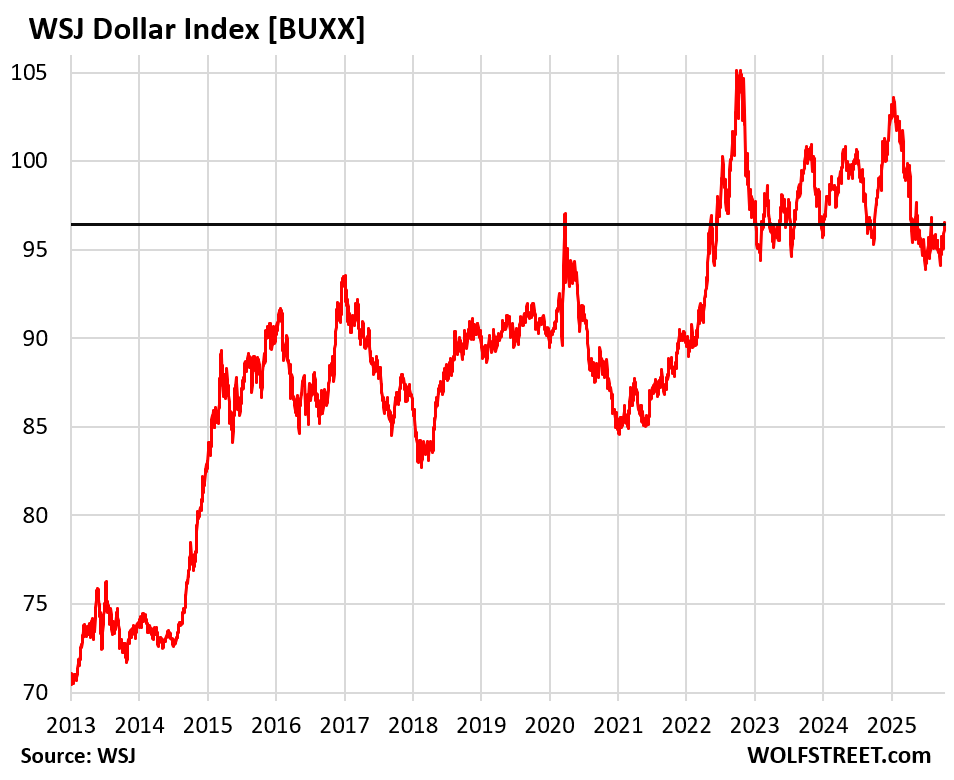
And of course, the dollar has bounced back some since the beginning of July with the WSJ Dollar Index rising today to 96.4, up by 2.6% from the low at the beginning of July.
The 16 currencies in the trade-weighted index are: Euro, Japanese Yen, Chinese Yuan, Canadian Dollar, Mexican Peso, South Korean Won, New Taiwan Dollar, Indian Rupee, Hong Kong Dollar, Singapore Dollar, British Pound, Australian Dollar, New Zealand Dollar, Norwegian Krone, Swiss Franc, and the Swedish Krona.
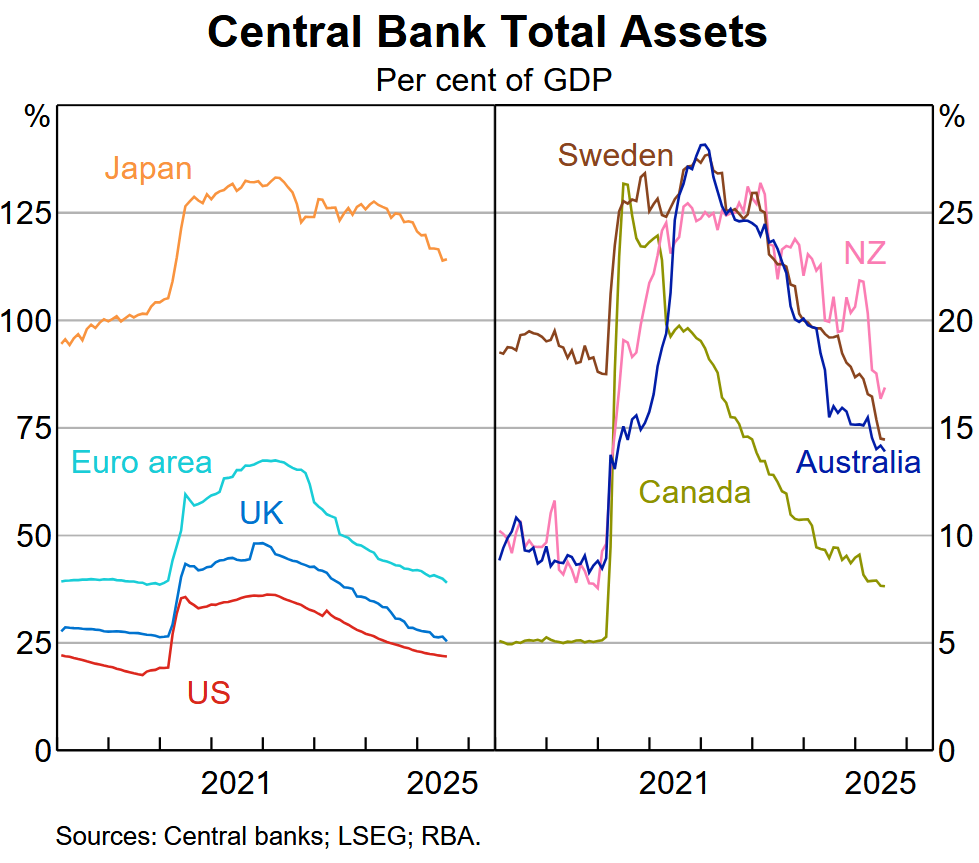
The Fed has been doing the opposite of “money printing” for over three years, having shed $2.4 trillion in assets by now – “money unprinting?” – and it continues to shed assets under its Quantitative Tightening program, and folks promoting the debasement trade need to take a look at this:
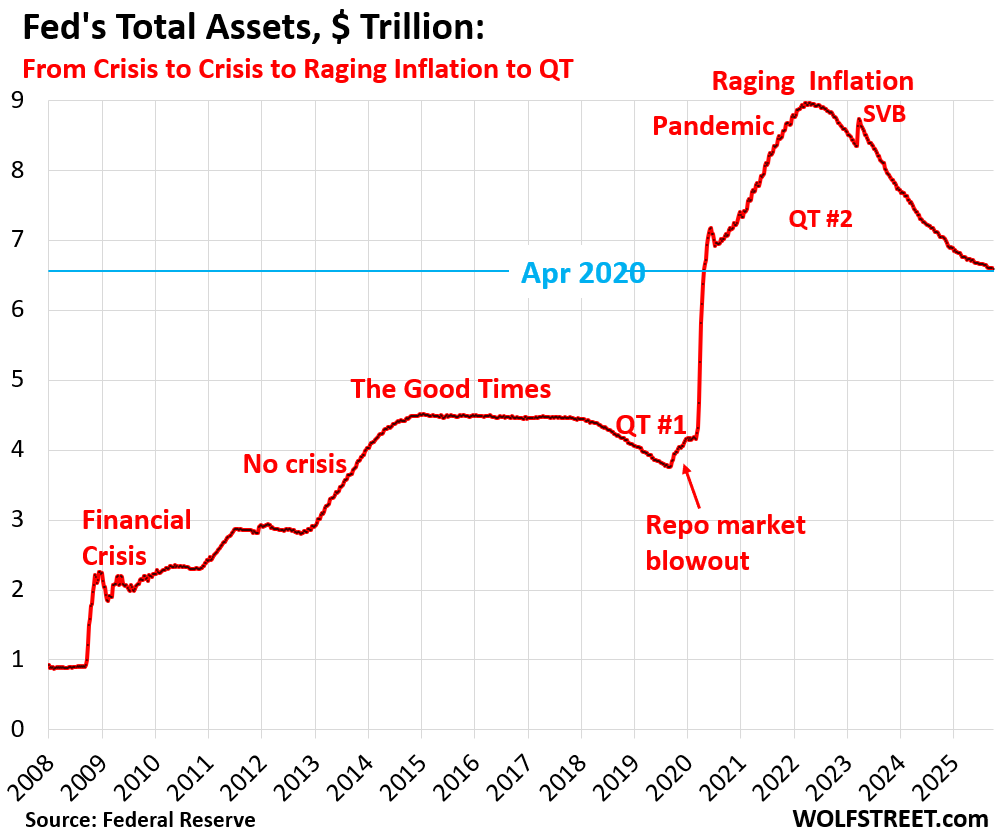
Other central banks too have been shedding assets under their QT programs, most notably the ECB and the Bank of Japan. Here are the balance sheets of some of the major central banks in relationship to the size of their economies, another eye-opener of what the debasement trade faces: Amazing How the Money-Printing World Has Reversed.

Source link

